
As marketers, it's pivotal that we measure our work.
How many leads are we generating? What are our best channels? How quickly are our leads closing? And perhaps most importantly, how much revenue are our leads bringing in?
There are lots of metrics that matter. While we all wish otherwise, there's no silver bullet report -- no single metric that sums up all of our efforts. That's where dashboards come in. 
The basic concept of a dashboard? Take a series of reports and put them next to each other. Sounds simple enough. Creating a dashboard is easy. However, creating a great audience-aware dashboard that can be easily iterated on over time is not so easy. In fact, dynamic marketing dashboards take a lot of planning and forethought.
Not sure where to start? It's all about asking the right questions.
26 Questions to Ask Before Creating Your Next Marketing Dashboard
1) Why is the dashboard being created?
If you're a fan of Simon Sinek, you're familiar with the concept of "starting with why." (If you're not, check out his TED talk, then come right back.)
Make sure you're creating a dashboard for the right reasons. For example, are you creating a dashboard when a single report would do the trick?
2) Who is the dashboard for?
Will you be presenting to your CEO? The VP of Sales? The Board of Trustees? Your Social Media team? In marketing, we construct our content with our buyer personas in mind. When creating a dashboard, keep your audience in mind.
3) What questions do they need answered?
The CEO is on the hook for the company's bottom line. She likely cares less about your inputs (how many hours you put in, how you titled your blog posts) and more about your outcomes and big-picture results. Other members of your organization value other components of your reports.
Before creating your dashboard, write down a few of the questions your audience needs to answer --- chances are, they'll be asking them come presentation time.
4) How much time do they have to review the numbers?
Will they review the numbers for fifteen minutes? Or spend an entire three-hour meeting poring over them? The answer to this question determines how many reports your dashboard should include. If your audience won't spend much time with the data, only include the two or three most impactful reports.
5) What language do they speak?
We're not talking about English, Spanish, or Arabic. Think about what type of vocabulary they're familiar with. More importantly, which words don't they know? Do they know what a Marketing Qualified is? How familiar are they with the concept of Organic Search?
If you don't ask this question, you run the risk of presenting data that will go over the head of your audience. Not sure where to start? Read through emails your audience has sent you in the past, or ask your teammates.
6) How data-savvy are they?
As marketers, many of us geek out over web analytics. Does your audience? If you're speaking to someone who doesn't love data as much as you do, stick to simpler reports.
7) Do they need to know the story behind the data?
If so, be ready to tell it.
8) How nitpicky do they get?
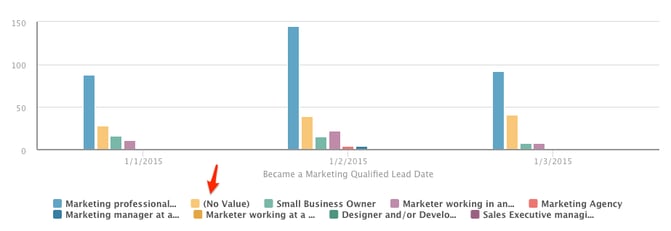
Make sure you can explain any data inaccuracies or outliers. If "No value" or "Encrypted Keywords" appears in the data, be ready to discuss.
9) What tools do you have at your disposal?
Does your company use a marketing analytics tool? Google Analytics? Excel? A whiteboard?
10) How much time can you block off?
Hold yourself accountable for building the dashboard. Don't save it until the last minute.
11) What format should it be in?
Should the dashboard be housed in an online tool? Should it live in Excel? Does it need to be presented as a slideshow at the next board meeting?
12) What other members of the organization do you need on your team?
Do you have a business operations team that controls certain tools? Does the sales team hold the keys to revenue data? Align yourself with internal stakeholders, and set proper expectations on what you need and when you need it.
13) Which metrics should the dashboard include?
Every organization values different KPIs. Use your answers to questions three and five to get going in the right direction. If you're not sure where to begin, raw data and conversion rates on visits, leads, and customers are a great starting point.
14) What should the dashboard not include?
When we set goals at HubSpot, we identify both positive and negative aspects --- things we'll commit to accomplishing, and others that we'll intentionally exclude from focus. Are there certain metrics that you're deprioritizing?
15) Does the dashboard need more than just visuals?
Will every member of your audience be presented the information on your dashboard in a live session? Often, it's constructive to add additional context to your dashboards with help text.

16) What time frame makes the most sense?
For some organizations, monthly check-ins work best; for others, quarterly works better. Think back to question two. For the questions your audience is asking, how often do they need answers?
17) Which report is most important?
Prioritize the report with the biggest impact --- make it the biggest, and place it front and center on your dashboard.

18) What types of graphs fit the data best?
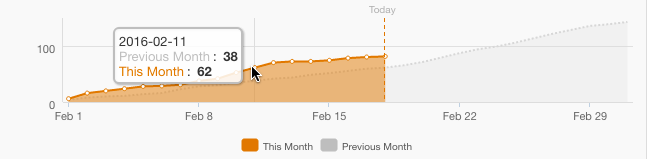
If you're plotting trends over time, use line and area charts. If you're comparing values, try a bar or column visual instead.
Here's a quick example. Take a look at the two charts below. The same data is presented, but notice how the second graph shows a more compelling trend in MQL growth over time.
Before:
After:

Not sure how to choose chart types? Here's a great resource to get you started.
19) Do you have benchmarks or goals to include?
Does it make sense to plot your data compared to a previous time period, or to a goal you set in the past? Do you have competitive data to use as a benchmark?
20) Does the dashboard need to be segmented?
Reporting on all your data is valuable, but it often doesn't tell the full story. For example, if your marketing team is divided into personas or countries, find a way to present each segment's unique data.
21) What actions do you want to drive out of each report?
Never run a report just for the sake of it --- for each data point you highlight, make sure you have a tangible strategic takeaway to share with your team. Don't walk away from the report with nothing at all.
22) Do you need more than one version of the dashboard?
If you have more than one audience, create unique variations that speak to each one's most pressing questions.
23) Who owns the dashboard?
Are you charged with creating the dashboard every month? If you win a free trip to Hawaii next month and are out of the office, who will create the dashboard?
24) Who can access it?
Make sure that every member of the team who needs to see the dashboard has the correct level of access within your tool of choice. On the flipside, keep unwanted sets of eyes out of the data by customizing permissions.
25) How will you distribute it?
If your system allows, set up an automated email at your chosen frequency to save yourself the manual send each time. At HubSpot, the marketing team receives a lead generation dashboard at noon each day with month-to-date data. Depending on the time frame your team chose in question 16, pick the cadence that makes the most sense.
26) Does your process need to be repeatable? How will you iterate on it?
If you need to recreate your dashboard in the future, make it easy on yourself by documenting the process in a Google doc or internal Wiki page. Note the parts that were trickiest and jot down specific instructions for next time.
What else do you keep in mind when creating marketing dashboards? Share your thoughts in the comments.
No comments:
Post a Comment