 You and I sift through a lot of data for our jobs. Data about website performance, sales performance, product adoption, customer service, marketing campaign results ... the list goes on.
When you manage multiple content assets, such as social media or a blog, with multiple sources of data, it can get overwhelming. What should you be tracking? What actually matters? How do you visualize and analyze the data so you can extract insights and actionable information?
More importantly, how can you make reporting more efficient when you're busy working on multiple projects at once? 
One of the struggles that slows down my own reporting and analysis is understanding what type of chart to use -- and why. That's because choosing the wrong type of chart or simply defaulting to the most common type of visualization could cause confusion with the viewer or lead to mistaken data interpretation.
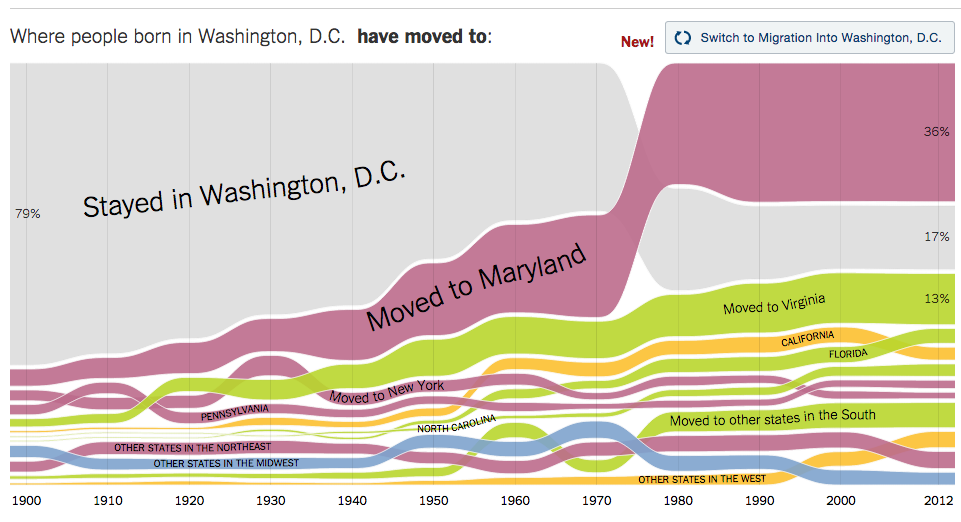
Consider this chart from The New York Times' project on where people born in a state move to. It visualizes a large amount of data accumulated during more than 100 years. Yet, it is easy to understand, and it clearly highlights interesting trends.
To create charts that clarify and provide the right canvas for analysis, you should first understand the reasons why you might need a chart. In this post, I'll cover five questions to ask yourself when choosing a chart for your data. Then, I'll give an overview of 13 different types of charts you have at your disposal.
5 Questions to Ask When Deciding Which Chart to Use
1) Do you want to compare values?
Charts are perfect for comparing one or many value sets, and they can easily show the low and high values in the data sets. To create a comparison chart, use these types of graphs:
- Column
- Bar
- Circular Area
- Line
- Scatter Plot
- Bullet
2) Do you want to show the composition of something?
Use this type of chart to show how individual parts make up the whole of something, such as the device type used for mobile visitors to your website or total sales broken down by sales rep.
To show composition, use these charts:
- Pie
- Stacked Bar
- Stacked Column
- Area
- Waterfall
3) Do you want to understand the distribution of your data?
Distribution charts help you to understand outliers, the normal tendency, and the range of information in your values.
Use these charts to show distribution:
- Scatter Plot
- Line
- Column
- Bar
4) Are you interested in analyzing trends in your data set?
If you want to know more information about how a data set performed during a specific time period, there are specific chart types that do extremely well.
You should choose a:
- Line
- Dual-Axis Line
- Column
5) Do you want to better understand the relationship between value sets?
Relationship charts are suited to showing how one variable relates to one or numerous different variables. You could use this to show how something positively effects, has no effect, or negatively effects another variable.
When trying to establish the relationship between things, use these charts:
- Scatter Plot
- Bubble
- Line
13 Different Types of Charts for Analyzing & Presenting Data
To better understand each chart and how they can be used, here's an overview of each type of chart.
1) Column
A column chart is used to show a comparison among different items, or it can show a comparison of items over time. You could use this format to see the revenue per landing page or customers by close date.

Design Best Practices for Column Charts:
- Use consistent colors throughout the chart, selecting accent colors to highlight meaningful data points or changes over time.
- Use horizontal labels to improve readability.
- Start the y-axis at 0 to appropriately reflect the values in your graph.
2) Bar
A bar chart, basically a horizontal column chart, should be used to avoid clutter when one data label is long or if you have more than 10 items to compare. This type of visualization can also be used to display negative numbers.

Design Best Practices for Bar Charts:
- Use consistent colors throughout the chart, selecting accent colors to highlight meaningful data points or changes over time.
- Use horizontal labels to improve readability.
- Start the y-axis at 0 to appropriately reflect the values in your graph.
3) Line
A line chart reveals trends or progress over time and can be used to show many different categories of data. You should use it when you chart a continuous data set.

Design Best Practices for Line Charts:
- Use solid lines only.
- Don't plot more than four lines to avoid visual distractions.
- Use the right height so the lines take up roughly 2/3 of the y-axis' height.
4) Dual Axis
A dual axis chart allows you to plot data using two y-axes and a shared x-axis. It's used with three data sets, one of which is based on a continuous set of data and another which is better suited to being grouped by category. This should be used to visualize a correlation or the lack thereof between these three data sets.

Design Best Practices for Dual Axis Charts:
- Use the y-axis on the left side for the primary variable because brains are naturally inclined to look left first.
- Use different graphing styles to illustrate the two data sets, as illustrated above.
- Choose contrasting colors for the two data sets.
5) Area
An area chart is basically a line chart, but the space between the x-axis and the line is filled with a color or pattern. It is useful for showing part-to-whole relations, such as showing individual sales reps' contribution to total sales for a year. It helps you analyze both overall and individual trend information.

Design Best Practices for Area Charts:
- Use transparent colors so information isn't obscured in the background.
- Don't display more than four categories to avoid clutter.
- Organize highly variable data at the top of the chart to make it easy to read.
6) Stacked Bar
This should be used to compare many different items and show the composition of each item being compared.

Design Best Practices for Stacked Bar Charts:
- Best used to illustrate part-to-whole relationships.
- Use contrasting colors for greater clarity.
- Make chart scale large enough to view group sizes in relation to one another.
7) Pie
A pie chart shows a static number and how categories represent part of a whole -- the composition of something. A pie chart represents numbers in percentages, and the total sum of all segments needs to equal 100%.

Design Best Practices for Pie Charts:
- Don't illustrate too many categories to ensure differentiation between slices.
- Ensure that the slice values add up to 100%.
- Order slices according to their size.
8) Scatter Plot
A scatter chart will show the relationship between two different variables or it can reveal the distribution trends. It should be used when there are many different data points, and you want to highlight similarities in the data set. This is useful when looking for outliers or for understanding the distribution of your data.

Design Best Practices for Scatter Plots:
- Include more variables, such as different sizes, to incorporate more data.
- Start y-axis at 0 to represent data accurately.
- If you use trend lines, only use a maximum of two to make your plot easy to understand.
9) Bubble
A bubble chart is similar to a scatter plot in that it can show distribution or relationship. There is a third data set, which is indicated by the size of the bubble or circle.

Design Best Practices for Bubble Charts:
- Scale bubbles according to area, not diameter.
- Make sure labels are clear and visible.
- Use circular shapes only.
10) Waterfall
A waterfall chart should be used to show how an initial value is affected by intermediate values -- either positive or negative -- and resulted in a final value. This should be used to reveal the composition of a number. An example of this would be to showcase how overall company revenue is influenced by different departments and leads to a specific profit number.

Chart via Baans Consulting
Design Best Practices for Waterfall Charts:
- Use contrasting colors to highlight differences in data sets.
- Choose warm colors to indicate increases and cool colors to indicate decreases.
11) Funnel
A funnel chart shows a series of steps and the completion rate for each step. This can be used to track the sales process or the conversion rate across a series of pages or steps.

Design Best Practices for Funnel Charts:
- Scale the size of each section to accurately reflect the size of the data set.
- Use contrasting colors or one color in gradating hues, from darkest to lightest as the size of the funnel decreases.
12) Bullet
A bullet graph reveals progress toward a goal, compares this to another measure, and provides context in the form of a rating or performance.

Design Best Practices for Bullet Graphs:
- Use contrasting colors to highlight how the data is progressing.
- Use one color in different shades to gauge progress.
13) Heat Map
A heat map shows the relationship between two items and provides rating information, such as high to low or poor to excellent. The rating information is displayed using varying colors or saturation.
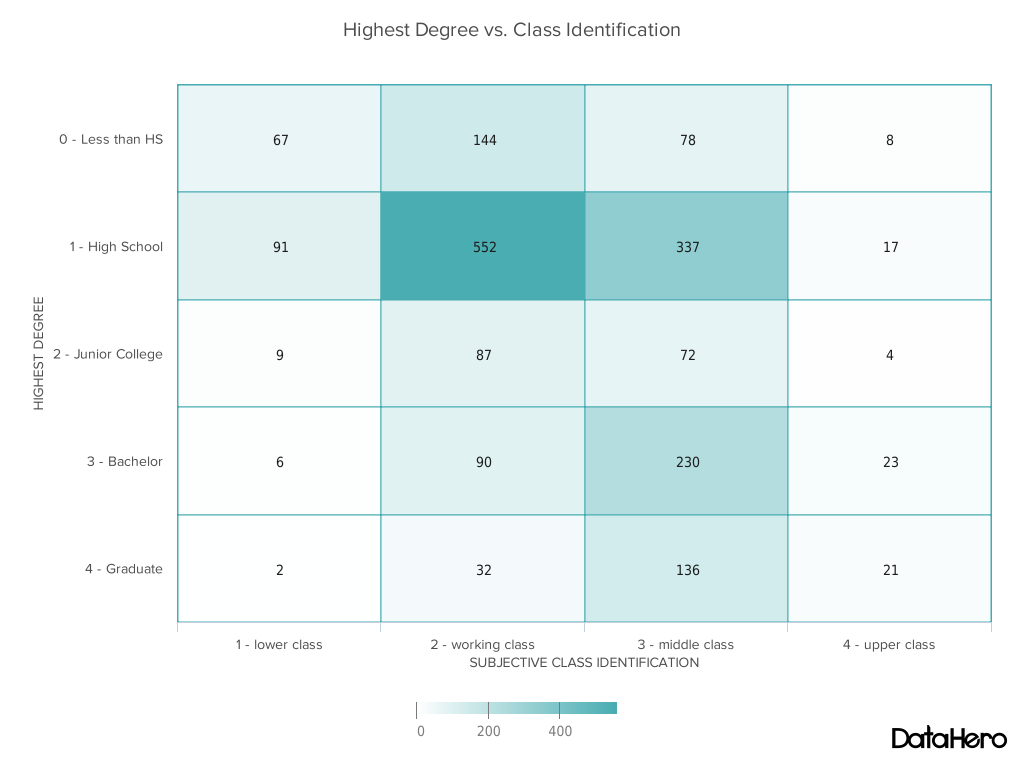
Design Best Practices for Heat Map:
- Use a basic and clear map outline to avoid distracting from the data.
- Use a single color in varying shades to show changes in data.
- Avoid using multiple patterns.
What tips do you have for visualizing data? Check out our ebook on how to use data to win over your audience, and share your tips in the comments below!
Editor's Note: This post was originally published in May 2015 and has been updated for accuracy and comprehensiveness.


No comments:
Post a Comment