When it comes to moving people and making deliveries, few companies are more widespread and more widely-recognized than Uber.
But how do they do it? And what can we learn from them? As it turns out, there’s a great deal of data being collected, produced and visualized behind the scenes — all working to create a more efficient company and impact transportation as a whole. Let’s take a closer look.
The Company Behind the Data
Uber was originally started as a black car-hailing service: UberCab, in San Francisco.
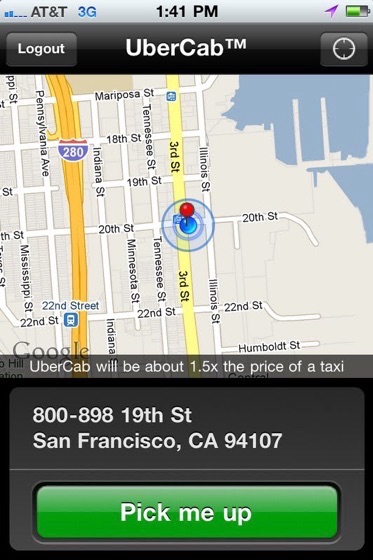
Although it cost about 1.5 times as much as a traditional cab, the fact that you could hail an UberCab from your smartphone was a huge hit with consumers and new cities were added quickly. Other ventures, such as a bike delivery service and food delivery, were also launched and tested in select cities.
How it Works
Getting a ride from an Uber driver is beautiful in its simplicity: simply open the app, set the pickup location, request a car, get picked up and pay with the tap of a button. But there’s a great deal of data wrangling going on to make all of this happen in a (relatively) smooth process. Add to that the fact that sometimes there are things out of even Uber’s control, like poor city transportation infrastructure, traffic jams, uncooperative drivers and much more.
Despite these setbacks, Uber has changed the way we move and is poised to change even more as the service comes to more and more cities. But what’s actually happening in the background and what can we learn from it?
The Process Behind the Scenes
Uber has a massive database of drivers, so as soon as you request a car, Uber’s algorithm goes right to work – in 15 seconds or less, it matches you with the driver closest to you.. In the background Uber is storing data for every trip taken — even when the driver has no passengers. All of this data is stored and leveraged to predict supply and demand, as well as setting fares. Uber also looks at how transportation is handled across cities and tries to adjust for bottlenecks and other common issues.
Uber also gathers data on its drivers. In addition to collecting non-identifiable information about their vehicle and their location, Uber also monitors their speed and acceleration, and checks to see if they are working for a competing company as well (such as Lyft).
If you’re reading this wondering if it’s a gross invasion of privacy – you aren’t the first. But Uber is very clear about how it uses the data gathered on its platform. A section of its privacy policy for U.S. customers and drivers reads:
Uber uses your personal data in an anonymised and aggregated form to closely monitor which features of the Service are used most, to analyze usage patterns and to determine where we should offer or focus our Service. We may share this information with third parties for industry analysis and statistics.
While the ever-present spectre of data misuse is nipping at Uber’s heels, there’s no doubt that the anonymous, aggregated data they collect insights from is nothing short of amazing.
All of this data is collected, crunched, analyzed and used to predict everything from the customer’s wait time, to recommending where drivers should place themselves via heatmap in order to take advantage of the best fares and most passengers. All of these items are implemented in real-time for both drivers and passengers alike.
Monitoring Supply and Demand
One of Uber’s biggest uses of data (and likely the one that draws the greatest ire from passengers) comes in the form of surge pricing, a model nicknamed “Geosurge” at Uber. If you’re running late to an appointment and you need to book a ride in a crowded downtown space, be prepared to pay almost twice as much for it.
Back in 2011, during New Year’s Eve in New York, a journey of one mile went from $37 to $135 over the course of the night.
This kind of dynamic pricing is similar to the pricing strategy used by hotels and flights for their weekend or holiday fares and rates – except Uber leverages predictive modeling in real-time based on traffic patterns, supply and demand. It has even been granted a patent on this type of pricing.
If you’re thinking this would have a ripple effect on how many people request Uber rides at a time – you’d be right. So Uber doesn’t just flippantly flip the Geosurge switch every time it wants to make extra money. Instead, it uses –you guessed it– data science to analyze the short term and long term effects of surge pricing on customers.
In the short term, surge pricing substantially affects the rate of demand, while long-term use could be the key to retaining or losing customers. Customer backlash on rate-hiking is strong, so Uber has considered using machine-learning algorithms to predict where demand will be strong, so that drivers can adequately prepare to meet that demand, and surge pricing will be significantly reduced. This new system has not yet been released, but Uber knows that in order to get and maintain a strong customer and driver base, it needs to put data to work for it in new and innovative ways.
They do this by building a myriad of in-house data wrangling systems, from Argos, which monitors millions of system interactions and metrics and alerts engineers in cases of serious outages to Gurafu, a tool which engineers a better, safer route in real-time for drivers. Systems like these are also put in place for new Uber service roll-outs, including UberPOOL and UberEATS.
Keep in mind, however, that supply and demand data are not the same from city to city, so Uber engineers devised a way to map the “pulse” of a city to connect drivers and riders more efficiently. And if you think all major metropolitan cities are alike – think again. Just look at how New York City compares to London:
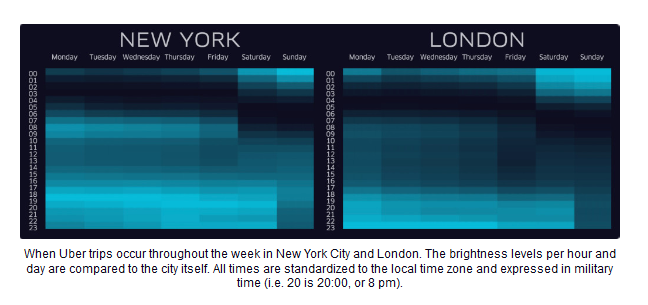
Passengers are out and about in New York City during the evenings, while London is bright well into the night — demonstrating that what works well for Uber in one city doesn’t necessarily correspond to another.
Visualizing Data Analytics
Of course, collecting all this information is just one step in the big data journey. The real question is — how does Uber determine the best way to make decisions using this information? How do they glean actionable points out of the data they collect?
For example, Uber manages billions of GPS locations. Every minute, their platform juggles millions of events. How do they leverage these details into a way to better manage moving people and things from place to place?
Their answer is data visualization.
According to Uber’s own data intelligence blog, data visualization specialists range from computer graphics professionals to information design. They handle everything from mapping and framework developments to data that the public (such as drivers) see. And a lot of these data extrapolations and visualizations have never been done before, which has created a need for tools to be developed in-house.
Without getting too technical, some of the many applications for their data visualization challenges include:
Mapping Applications for City Ops Teams and General Managers
These are the teams at Uber who need up-to-the-minute details of current supply and demand. In the same vein, marketing professionals might need aggregate data to plan a campaign. So the Uber engineering team built a system that would show distributions of Uber drop-offs in real-time as you drag your cursor over a given area.
Another example is of particular importance in big cities, where understanding the density of a given area may lead to dynamic pricing changes. Uber demonstrates this with a combination of layers that let them drill-down to see specific areas in more detail:
But these aren’t just data visualizations for engineers and data scientists to pore over. Data visualization also helps the public better understand what Uber does and how it works, such as this visualization of how uberPOOL helps reduce traffic — a visualization that was shared during founder Travis Kalanick during his TED Talk:
What Can We Learn from This?
It’s one thing to demonstrate how Uber uses data science, but another completely to discover what their findings mean for the rest of us (beyond just a ride on-demand). Uber teaches us a great deal about using big data – and not just sitting on it. They also teach us to look for connections in every possible ounce of that data. Every time you’re collecting information but not using it, there’s the potential for a missed opportunity to grow and improve your business.
And if such a tool doesn’t exist to crunch the data the way you want it — take steps to make it work. Even if that means rudimental cobbling of existing tools, much of what Uber has done needed to rework existing systems so that they fit an entirely new mold. This has allowed them to remain flexible and adapt on-the-fly — key traits that any good digital marketer should possess.
It’s also worth realizing that, much in the same way as Uber records the pulse of a given city, that not every answer you glean from your data can be carried over and applied in a blanket-like fashion to a completely different city. That gathering the data independently and analyzing it for what it is (and not how it matches or doesn’t match some other collection) is what’s going to make the insights and opportunities pop out.
And finally, take that inspiration and run with it. Uber started out small, but in seeing the monumental success they gained in San Francisco, realized that such a service could be extremely beneficial across the country and around the world. And not just with cars but also SUVs, luxury cars, food, bike messenger deliveries and much more. The potential was there — untapped and waiting to be explored. It remains to be seen if these other services will ultimately succeed as much as the original Uber did, but no one can deny that they pounce on opportunities like no other.
By this point you may be wondering — all of this technology and data is being used — just to get a ride? But in fact, Uber is much more than that. It’s changing the way people and goods are moved around the world, in turn branching out to help reduce traffic congestion and pollution as well as bringing attention to infrastructure issues within cities. Uber is having a marked effect on our economy, our transportation system and our culture as a whole — concepts only made possible by the power of data.
What are your thoughts on how Uber uses data in its business and beyond? Share your experience with us in the comments below!
About the Author: Sherice Jacob helps business owners improve website design and increase conversion rates through compelling copywriting, user-friendly design and smart analytics analysis. Learn more at iElectrify.com and download your free web copy tune-up and conversion checklist today!
No comments:
Post a Comment