A few weeks ago we released Populations, a feature that helps marketing & product teams track key segments of people across the buyer journey.
We also have this cool little feature called Metrics, which does exactly as it says – it tracks your key metrics. And you’ll have a variety of metric types you can choose from. Conversion rate, average time between events, and number of times an event happened are just a few.
Together, these features can provide some useful insights on your marketing performance. You’ll be able to identify any red flags, potential issues, and spot what needs attention.
In this post, I’ll go through some Metrics and Populations SaaS marketers can set up to measure each stage of their funnel.
Metrics
The Metrics feature makes it easy to track conversion rates, product usage, and activation trends overtime. With metrics, you won’t have to bounce around between Google Analytics reports or goals to get a grasp on where the trends are. You’ll simply pull up the Metrics Dashboard and it’ll all be there for you.
Here’s a few metrics that SaaS marketers will find useful:
Signup Trends
As a marketer, you live and die by your ability to consistently deliver quality leads. Signups are the first required step a visitor must take to becoming a paying, loving customer.
So it doesn’t hurt to reiterate that these rates are crucial to your company’s success. You can set up a Metric that tracks people that visit your site and then signup, and expand your date range to over multiple years so you can get a big picture view on where your trends are.
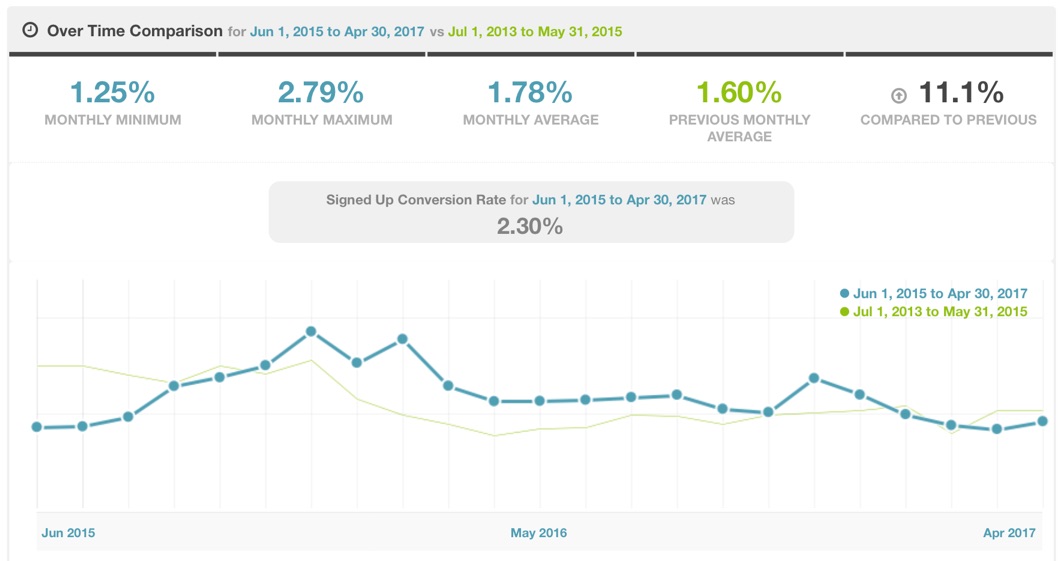
These are the conversion rates from June 2015 – April 2017. The green line is the background compares the previous period.
We see that it’s mostly held steady at around 2%. There was a bump late 2015 – early 2016, but it corrected to the mean. If this was your data, you’d know that you have some work to do to increasing conversions. And if you’ve been A/B testing to increase signup rates – it hasn’t worked (yet!). Time to start using the A/B Test Report to boost your conversion rates and revenue.
Signed Up to Paid
After signup, you have a new goal – getting those people through the onboarding process successfully, making sure they discover the value of the product, and then getting them to pay for your product. For most non-freemium SaaS companies, you’ll have to do this within 30 days!
This chart shows us an example conversion rate for customers signing up to paying for the product.
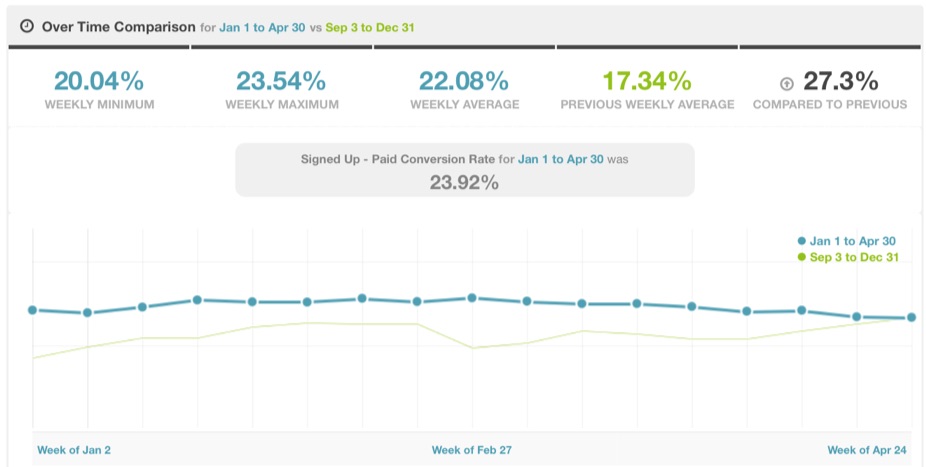
If this was your data, you would know you’re improving by looking at the green comparison line. But there’s always room for improvement – and if you A/B test enough and find the wins, you’ll see that blue line head up and to the right.
Those are a couple good Metrics to set up and keep an eye on. Now let’s check out some Populations that are worthwhile for SaaS marketers.
Populations
With Populations, you’ll set a criteria that’s important to your growth cycle and then see the people in that population overtime. You’ll see the trends overtime, and compare it to a certain amount of days ago.
Visited Site Multiple Times Without Signing up
If you look at your analytics (like Kissmetrics) you’ll find that not a lot of users signup on their first visit to your site. It often takes multiple touches and a few months before they hit that big green Signup button.
As a marketer, it’s useful to know just how many of your visitors are those that have visited multiple times before signing up. With Populations, you can set the criteria to basically say, “show me all the people that have visited the site at least 5 times but have never signed up”. Keep in mind that you can set it to as many times as you want (it doesn’t have to be 5) but we’ll use 5 as our example.
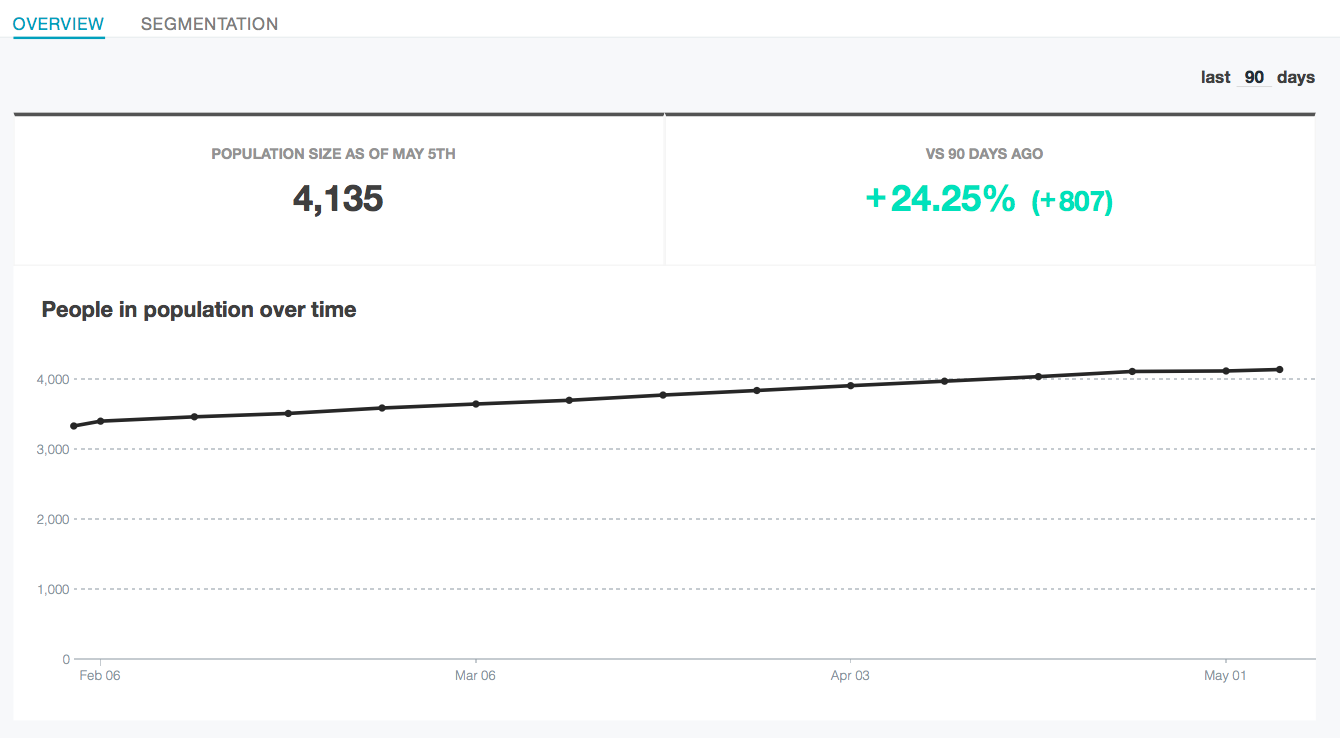
A Population like this won’t be too exciting. It should remain relatively flat (like above). You can get this to drop and get more people to signup by increasing conversion rates. But if this Population is increasing and your traffic isn’t, then you know you have a problem. More people are lurking without signing up.
You can segment the Population to dig for more insights. Let’s segment by Country to see if this reveals anything:
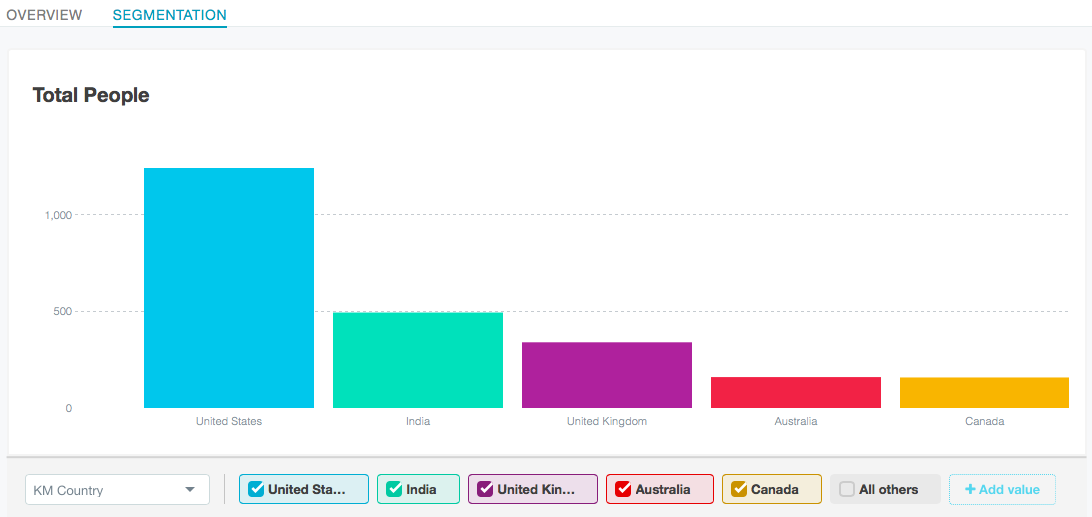
This will usually correlate with the highest-trafficked countries. So if most of your traffic is coming from United States, then the US will be #1 in this segment (as it is in this example). If you look through this data and notice it’s not correlating with traffic demographics, then you may uncover an issue. If this was your data, and if Australia is the biggest segment but isn’t your biggest traffic segment, you’ll know you have a problem with hesitant Aussies. You can also create a Population that narrows in on specific countries.
New Paid Users
This is what marketing is all about. At the end of day, you’re judged on the leads you bring in and the new paid users the company acquires because of your marketing activities. All the A/B tests, events, conferences, and paid marketing leads to this. If this Population (and the one we’ll get into next) is increasing, you’ve earned your bacon.
This Population is finding the people that were billed for the first time within the last month.
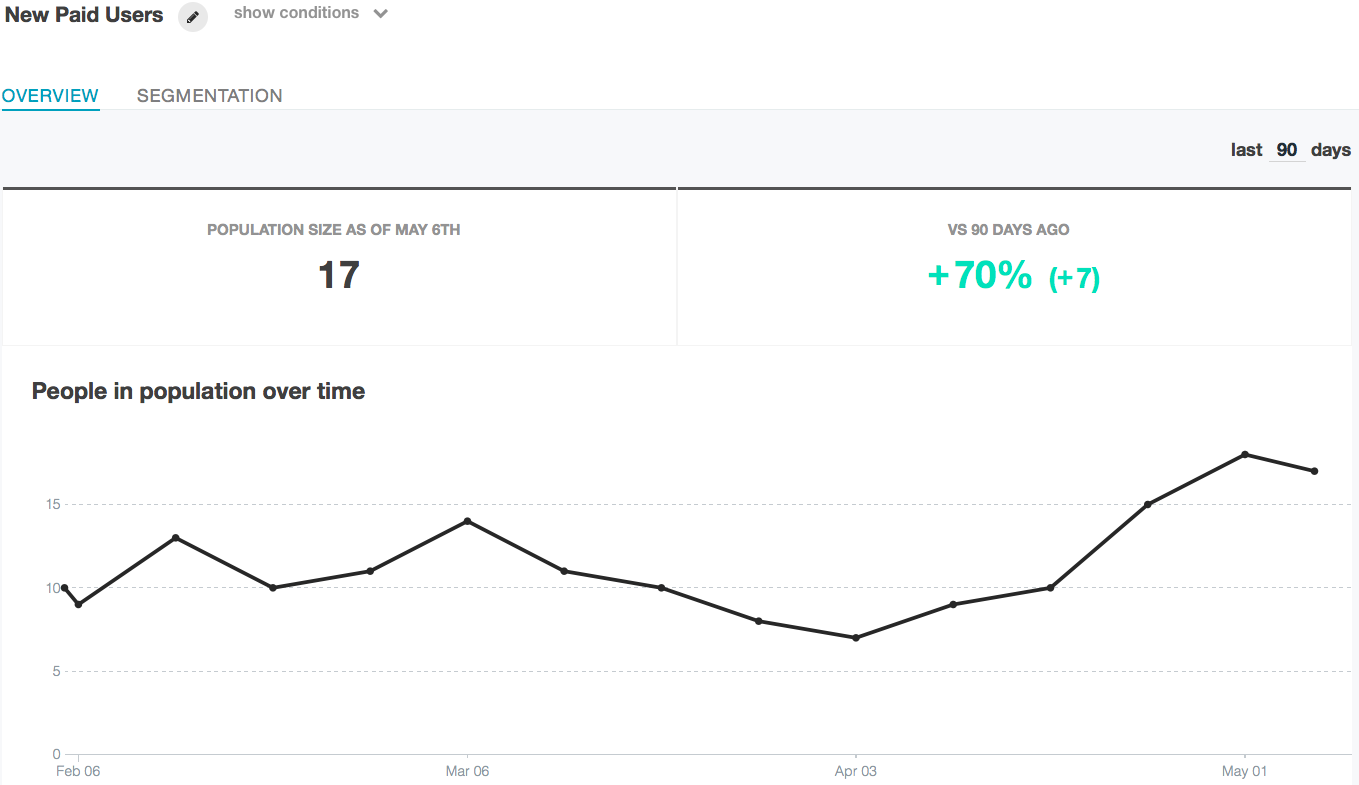
Not a bad Population. A little slope that begins about halfway through, but recovers strongly. And you’re 70% higher than you were 90 days ago! If this was your data, you’d have something to show your boss and colleagues to congratulate them on their progress.
Total Paid Users
Of any Population, this is the one you’ll want Up And To The Right™. If you’re bringing in solid leads, your onboarding works, sales can close, and you can retain customers, this Population should always be making you and your bosses happy.
To find your total paid users, you’ll have to have the proper events set up and firing correctly. And this goes for all Populations listed here and all of Kissmetrics. Events and properties need to be setup correctly. Setting up Kissmetrics is usually done by a developer.
Once you have those events and properties, you can create a Population and track your progress on bringing more paid users to the company.
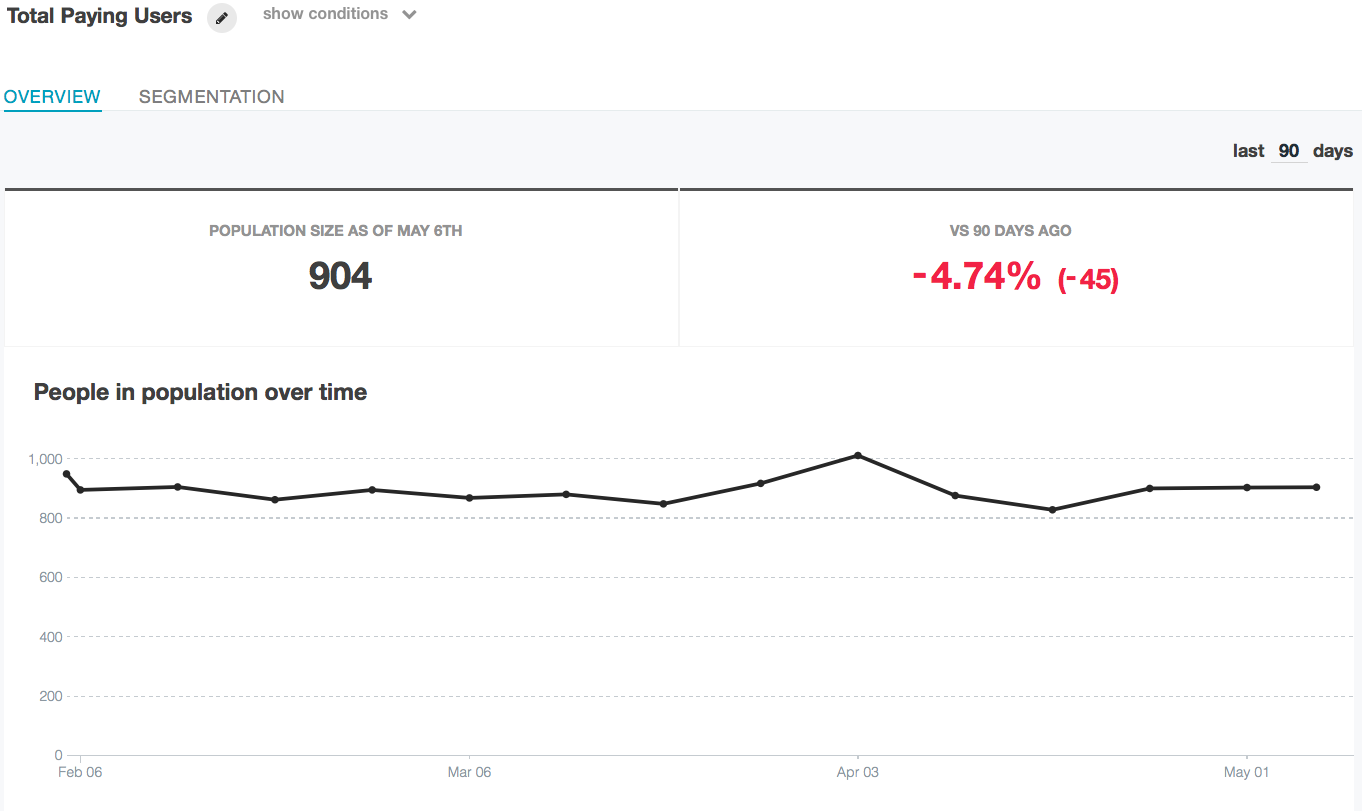
Alright, not great. You’re not Up and To The Right™, but it’s holding steady. You’re down about 5% from where you were 90 days ago. If this was your data and you’re concerned, the next step would be to investigate. The most obvious answer is that more customers churned than signed up.
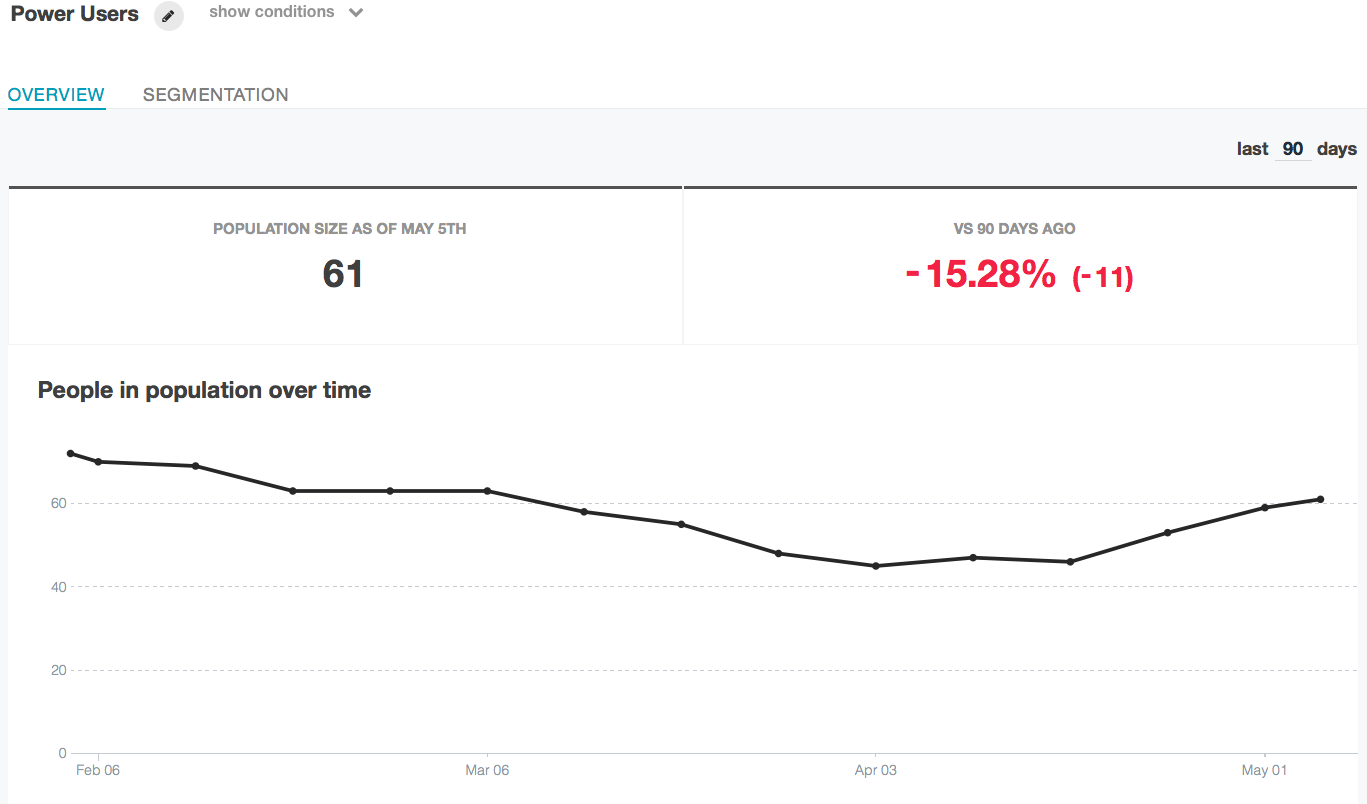
Power Users
Your power users are most likely to be the advocates of your company. They’ll provide you testimonials, refer their friends (if incentivized), and spread the word about your product. The more power users you have, the more successful your product (and company) will be.
You know who your power users are because they typically login and use your product more than anyone else. To create a Population, you can set the criteria to be “find all my current customers that have logged in at least 10 times in the past 5 days”.
Every product will be different. For some products you’ll have to login everyday to use, while others are more “set it and forget it”.
To find all the people in this Population, we’ll scroll down and click this button:

Click that and we’ll get a list of email addresses of our power users. We can contact each one and ask them to fill out a NPS survey, then filter those and ask for testimonials.
Keep Track of Your Growth Cycle with Kissmetrics
Keeping track of where you are in the growth cycle and all phases of the buyer’s journey is key to improving your marketing.
That’s what Kissmetrics is about – helping you identify what needs work, and giving you the tools to optimize.
About the Author: Zach Bulygo (Twitter) is the Blog Manager for Kissmetrics.
No comments:
Post a Comment