When it launched in 2014, Twitter Analytics marked a solid (if long overdue) move toward greater transparency and measurement abilities for all its users.
Since then, Twitter has continued to make upgrades to the tool, having created a standalone analytics app called Engage in 2016 and launching analytics for Twitter Moments.
Though users now have more insight into their Twitter account metrics, you might not be using this data to its full potential.
Perhaps you've poked around the Twitter Analytics homepage and figured out you can track impressions and metrics by promoted or organic activity ... and that's about it. The good news is there's much more you can discover in your Tweet activity dashboard -- you've just need to know where to look.
Beyond the basic metrics, here are some incredibly important things you can discover about your Twitter account and audience using Tweet Analytics.
How to Use Twitter Analytics
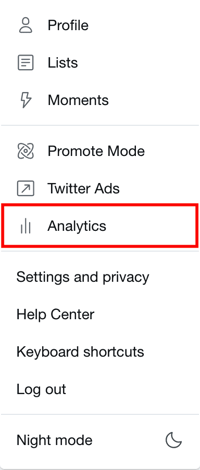
You can access Twitter Analytics by tapping your profile and selecting "Analytics" from the dropdown menu:
1. See Which Content Resonates With Your Audience
Understanding which types of content and topics your audience members most enjoy can help drive your social marketing and content strategy. What's the point in sharing content no one cares about or enjoys?
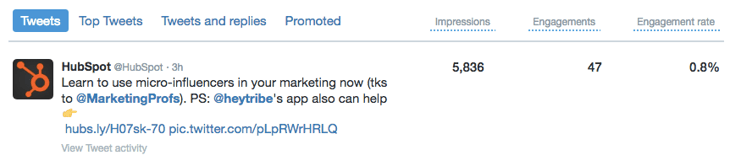
On the "Tweets" tab, you can see Impressions, Engagements and Engagement Rate (Engagements divided by Impressions) for each tweet, for paid and organic posts. Engagements include all activity on the tweet: retweets, follows, replies, favorites, and all clicks on the tweet, link, hashtag, etc.
For a more granular view of the volume of each type of engagement, you can click on the specific tweet:

Understanding which content items get the most engagement on Twitter is huge. If you can even commit 10 minutes a week to recording your top five or ten tweets by engagement so you can start seeing trends over time -- and then applying those insights to future tweets -- you'll be able to better connect with your audience.
2. Understand How People Interact With Your Tweets Over Time
This is a really common question among social media marketers and brands: What made my tweet take off?
Some tools can analyze your Twitter followers and recommend the best day of the week for you to tweet. There's also research out there showing when people are most likely to be active on Twitter. But of course, the best way to get to know your own audience is from your own account data.
On the Tweets dashboard, you can customize the date range you want to analyze to see when you published your highest-performing tweets:

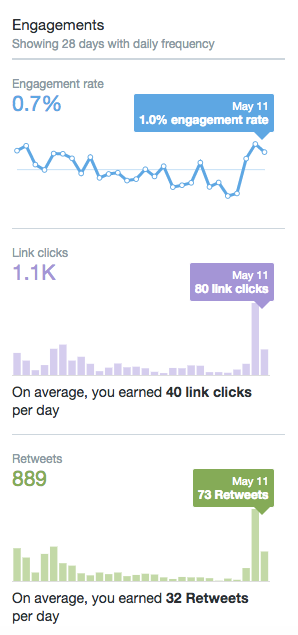
Twitter used to allow you to view a tweet's engagement over the course of a day, and I personally think it was a mistake to remove that feature. I hope they bring it back in an update soon so users can analyze the best time of day to tweet from their account.
3. Get to Know Your Followers
Twitter's audience data in the "Followers" tab contains a ton of valuable and useful insights. This is where you can really get to know the people who follow you.
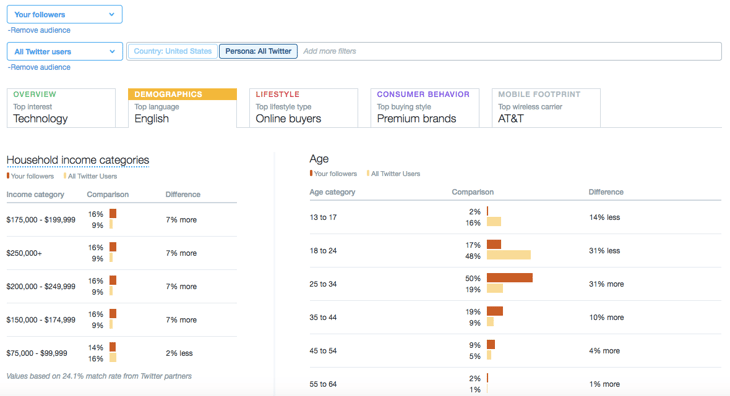
You'll find answers to questions like: Are your audience members more likely to be male or female? Which countries and cities are the majority from? What are their top interests? You can also see who your followers follow as well as your follower's top five most unique interests. Answering these questions can help you better identify what content to create and share on Twitter -- and when to share it.

You can also compare your Twitter followers to different segments -- for example, to all Twitter users total:
4. See Whether Your Follower Base Is Growing (or Shrinking)
I'd call myself a Twitter power user now, but it wasn't always so. For several years, I slowly grew my following up to about 8,000 followers. In the past few years that I've really focused on my Twitter presence, I've picked up another 704,000.
Now, Twitter allows you to track your follower growth. Twitter Analytics shows you how many followers you had on any given day with the interactive timeline pictured below. Hovering over various points on the timeline will show you the exact follow count on that day. It dates back to the day your account was started.

If you're seeing blips in your follower count over time, it's important to revisit your activity in those periods and see if you can learn from it. How often were you posting then -- and what were you posting about? Were you taking the time to reply to folks, too? Answering questions like these can help you explain these blips -- and avoid the same mistakes in the future.
5. Determine If Your Twitter Ads Are Worth the Money
I've been experimenting recently with paid promotions on Twitter. After reviewing my own data in Twitter Analytics, I realized my ads weren't as effective as I thought they would be.
In the Tweets tab, right at the top, there's a chart that gives an overview of your paid and organic tweet performance. Like other Twitter Analytics charts, this one is interactive, so hovering over specific parts will show you more precise numbers, as in the example below. Keep in mind that the data only goes back 91 days, so take advantage of the ability to export it regularly. You can make comparisons over longer periods of time in another program.

I'm not spending a ton on paid promotions -- around $100 a day when I use them -- but at a glance, I can see that compared to organic posts, they're not having a huge effect. If I were running specific promotions, I'd be interested in the Conversions information available in Twitter Analytics. But for getting more impressions on my content, it doesn’t seem worth it because I could get that exposure for free by just tweeting a few extra times per day.
Obviously, this will vary for every user, but this panel in Twitter Analytics is a pretty simple way to see what you need to make that decision.
Just below that chart, you can click "Promoted" to see all of your paid promotions in chronological order. This shows you how many engagements and impressions each one earned, helping you pinpoint which paid promotions are working (and which ones aren't).
Free Twitter Analytics Tools
- TweetReach
- Klear
- Keyhole
- Twitonomy
- Tweet Binder
- RiteTag
- Mentionmapp
- Hashtagify
Still other third-party analytics tools can help you do a deeper dive into content properties that Twitter Analytics won't give you as much data on. Want specifics on hashtag performance? Maybe you want more information on the most influential Twitter handles in your industry. These are the metrics you'll need outside help to find.
Below are some of the most widely used Twitter analytics apps and the types of data they're best for reporting on. Although most of them have paid plans that afford you multiple features, each of these tools offer free services that can give your Twitter game a boost of intelligence.
TweetReach
User, Keyword, and Hashtag Analytics
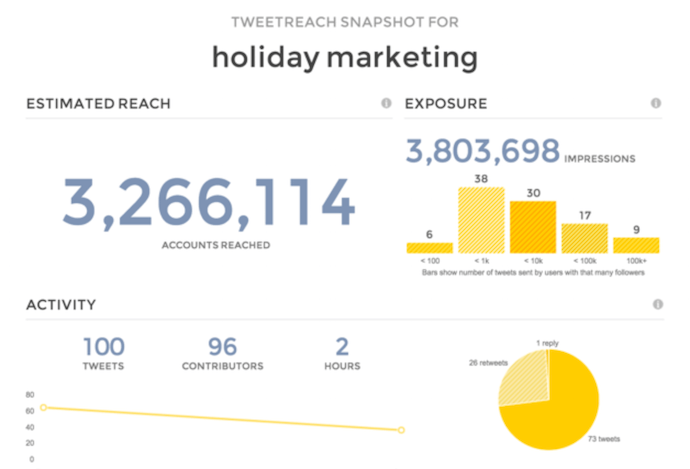
TweetReach is a free reporting tool that allows you to see how far your tweets and hashtags have traveled and who's engaged with them. You can also get "snapshot" reports of any user, hashtag, or tweets with certain keywords in them so you can understand what's being talked about in your industry in real time.
Klear
Influencer Analytics
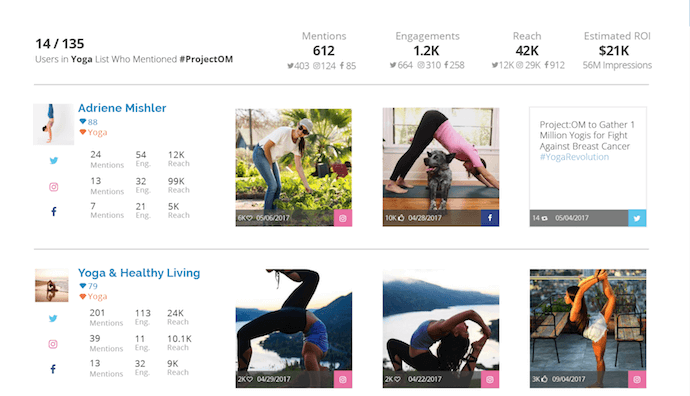
Klear focuses specifically on influencer marketing, tracking Twitter's most influential users and helping you determine who's making the most noise and greatest impact on certain topics of conversation. Compatible with Instagram, YouTube, and Twitter, the tool makes it easy to find, analyze, and manage your relationships with the people you want your brand to be associated with on social media.
Keyhole
Hashtag Analytics
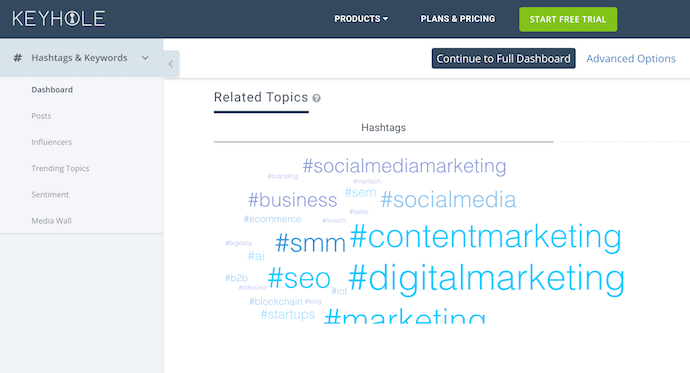
Keyhole takes Twitter users on a deep dive into the hashtags and topics they might like to create entire social media campaigns around. Start by performing free searches for hashtags, accounts, and topics you want to track. Then, for a paid subscription, use these insights to set up monitoring programs so you can find out who's saying what about you, your event, or your market.
Twitonomy
User, Keyword, and Hashtag Analytics
Twitonomy offers a full portfolio of data about the content you tweet and the users you follow. Most of this data is completely free, and you have multiple ways to visualize and report on this information. You can track posts from specific users, get smarter insights about your own followers, and more by signing into Twitonomy through Twitter directly.
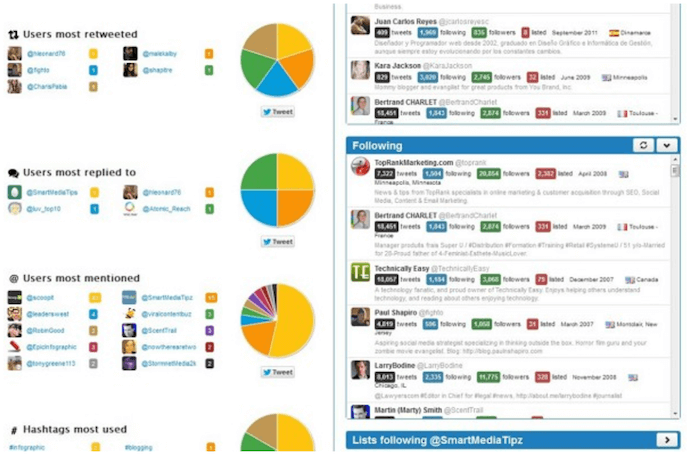
Tweet Binder
Campaign Analytics
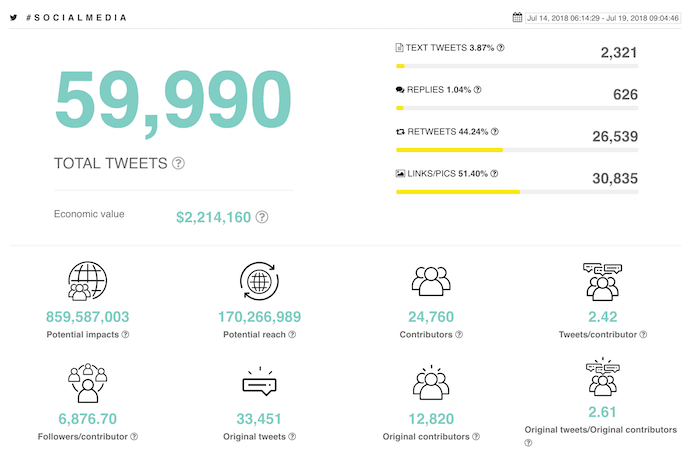
Tweet Binder is a campaign-focused analytics tool that allows you to view activity behind any hashtag, user, or keyword for free. Under its paid plans, the product gives you both Twitter and Instagram "walls" where you can see the impact of your own campaigns, making you a smarter promoter and event marketer over time. Tweet Binder's free hashtag report, shown above, gives you an idea of just how easy it is to see the data behind various Twitter trends.
RiteTag
Hashtag Analytics
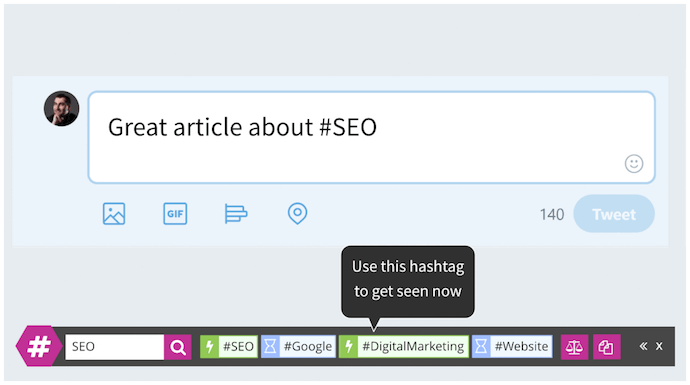
RiteTag doesn't just give you engagement metrics behind a hashtag -- it uses that data to give you real-time suggestions for which hashtag to use in each tweet you create. The platform integrates with a variety of marketing tools and social networks, allows you to create "tag sets" to refer back to, and recommends hashtags based on both text and visual media you want to post.
Mentionmapp
User, Mention, and Hashtag Analytics
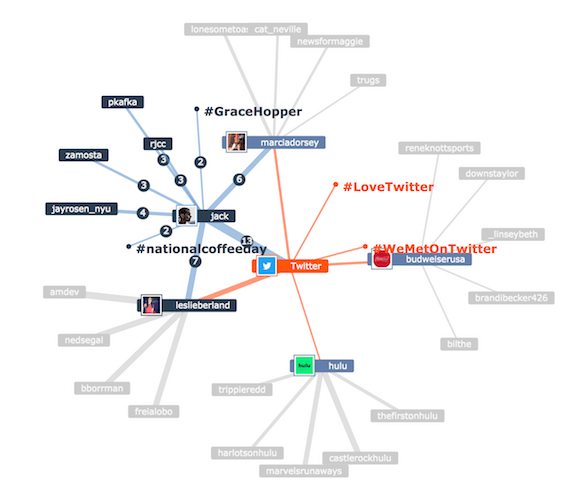
Mentionmapp is one of few Twitter analytics tools that presents conversation data in "map" form. Most of the tool is free to use under the "Seeker" platform, showing you not just who's talking to whom, but who's expanding on which topics and where a topic began. The map you create stays updated to Twitter trends as they happen.
Hashtagify
Hashtag Analytics
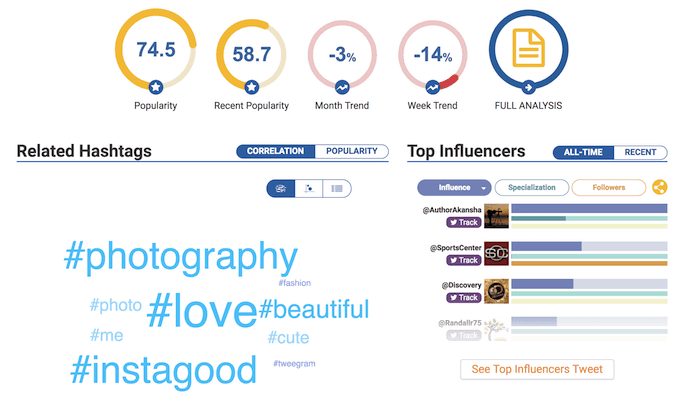
Hashtagify, as you might've guessed from its name alone, is a hashtag analytics tool that serves up a dashboard of information related to any hashtag you search. The product works for both Twitter and Instagram, organizing its data into various visual categories so you can properly decide with hashtags and topics you should get in on. As with each tool on this list, the free version of Hashtagify offers the dashboard above and a lightweight version of the full suite of analytics -- which is available through paid plans.
Exporting Data: How to Discover Even More Trends in Twitter Analytics
Twitter Analytics is great as an interactive dashboard for accessing increasingly granular data about your Twitter account performance.
The most useful feature I've found is the ability to export data from the Twitter API as a CSV file. Even power users with a ton of account activity can fairly quickly export their Analytics data.
To export your data, select the timeframe you'd like to use, and click the "Export Data" button in the top right corner of your Twitter Analytics Dashboard.

You can then sort through your exported data using Excel in ways not possible within the platform itself. For example, I extracted the time of day of my last 2500 tweets and plotted the tweet engagement rate vs. time of day, as shown here:
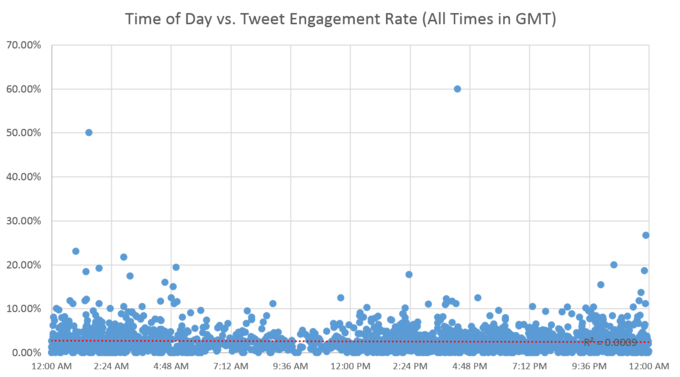
What I found was that the engagement rate (i.e. the # of engagements/impressions) held steady (on average) regardless of the time of day -- possibly because I have a ton of international followers. It got me thinking that I really ought to be scheduling my content for all hours of the day, not just during business hours in my local time zone. Sure, fewer people will see my updates at 2 a.m. local time, but those who do are just as likely to engage with the content as those who see it during business hours.
There are so many other columns of data in the CSV export, including the number of favorites, retweets, link clicks, replies, URL clicks, follows, etc. So you can do this kind of customized analysis on whatever metrics you care most about.
Ultimately, the best data is your own, so make time to check out Twitter Analytics and see what you can learn and do with it. Figure out which tweets resonate and why. Then, work those insights into your social media marketing strategy for a more successful way forward.
For more ideas, download HubSpot's guide to getting more Twitter followers.

No comments:
Post a Comment