In the fast-paced world of modern marketing, it’s often difficult to decide which kind of projects deserve the most amount of your team’s time and your company’s money. Some questions you might be wrestling with at this very moment:
Is it better to hire an SEO expert, or should you push harder on social media?
Should you give your sales team a bigger paycheck, or would you be better off with more paid advertisement?
The ironic thing is that you can have an army of different charts and tables at different resolutions, and yet still lack the answer to all these questions.
So how do you cut through the noise to track metrics that actually matter? How do you set up your metrics in a way that makes you ask the right questions and eventually helps you make informed decisions about where to allot your marketing time and money?
As the data scientist at a Bay Area tech startup, these are a few issues I’ve worked with our own marketing team to resolve, and they’re issues I know many other startups are trying to figure out as well.
I propose a three-step procedure to set up your marketing metrics to achieve two simple goals:
- Horizontally, you want to find out what your strong and weak acquisition stages are so that you never miss an opportunity.
- Vertically, you want to find out whether growth is stalling in any area so that you never miss a problem.
Keep these two goals in mind as you read through the following three-step procedure. And hopefully, when you go on to try these steps on your own, you’ll find you’re asking the right questions of them and designing a system that monitors metrics that really matter to your business growth.
1. Building blocks
The whole process starts from defining your key stages of conversion: turning someone who is not aware of your product, into a (repeated) payer of your product. Almost all marketing paths can be broken down into the following four stages:
- Awareness, which captures how people hear about you in the first place, including social media, forums, press coverage, referrals from external sites, paid prospecting campaigns, etc.
- Exposure, which sums up all the new visitors who visit your site or download your app to consider your value proposition and price point.
- Engagement, which is essentially repeated exposure or increased exposure based on some key behaviors before payment. These behaviors could be using a lot of free material on your site or app, or repeatedly coming back to your FAQ page, etc.
- Payment, which is the ultimate goal of your marketing efforts.
Moz has an excellent tutorial on the basis of these building blocks. It’s a great read. Below you’ll see the high-tech way that Moz explains each building block in detail.
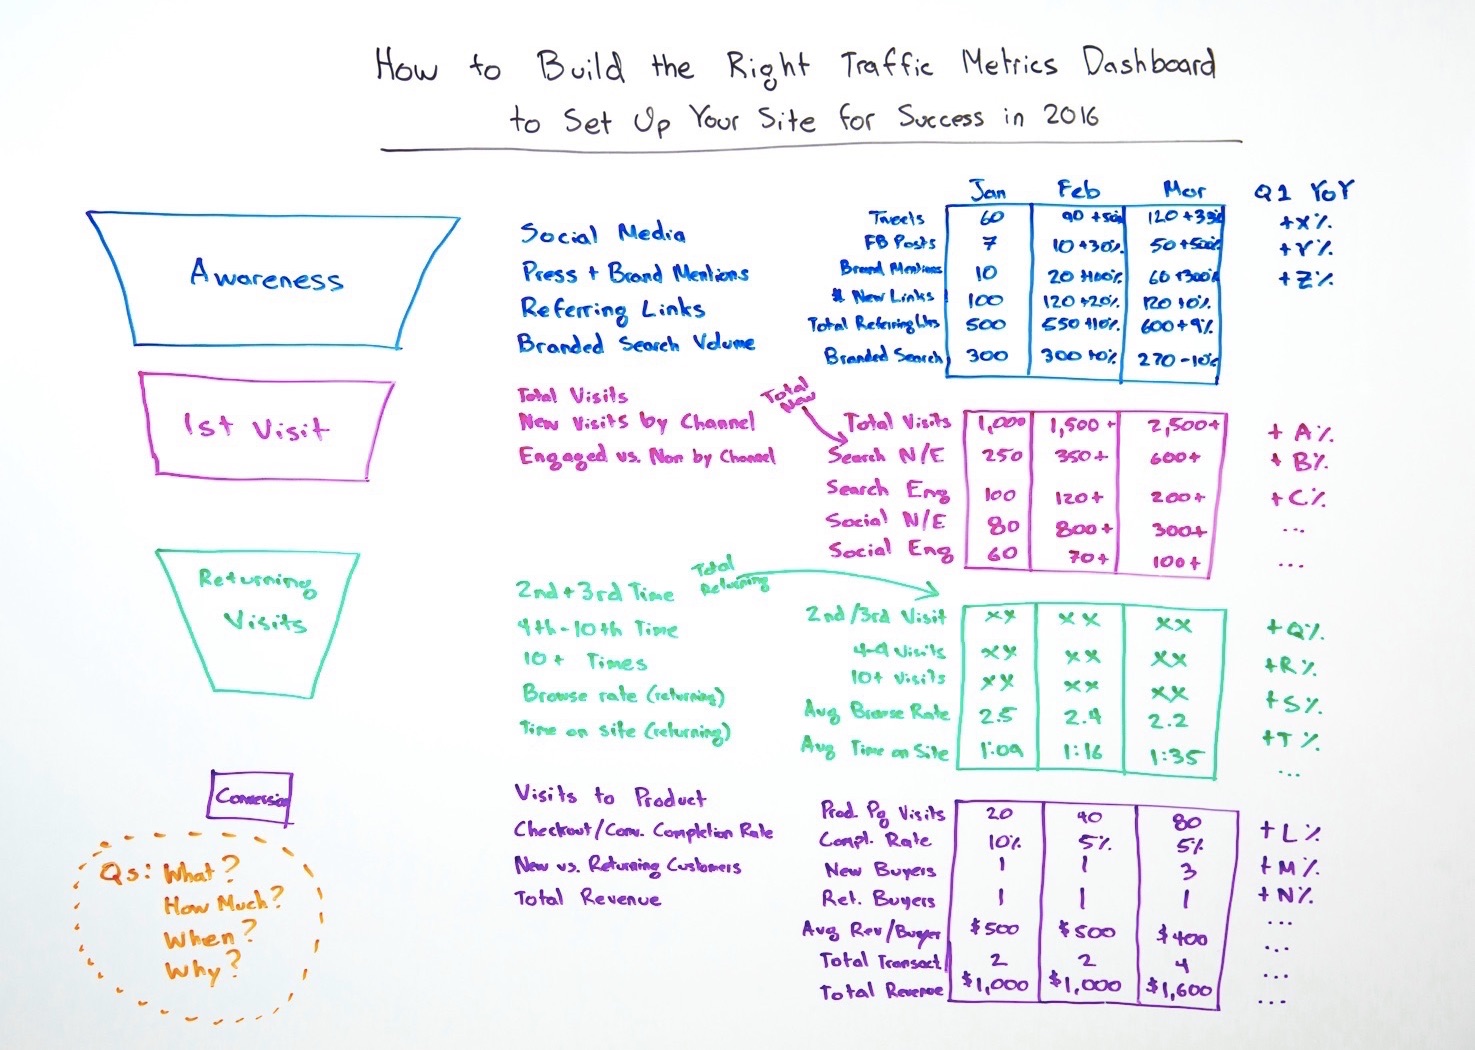
In spite of the seemingly straightforward setup of these four building blogs, there are three things I’ve seen marketing teams do wrong while pursuing them:
They lack consistency
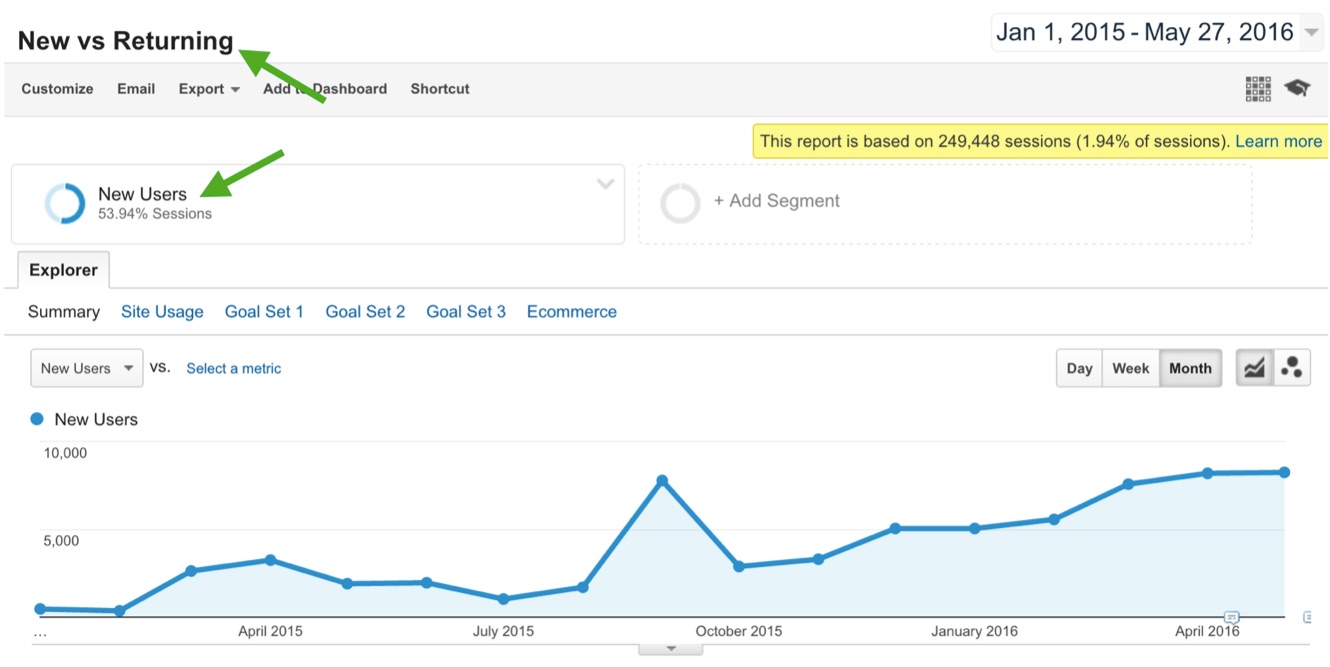
Most of the time when we talk about the exposure and engagement levels, we’re talking about unique visitors that could turn into potential customers. However, we often report awareness metrics with different unit, like pageviews or mentions.
For example: You might report that there were 30K pageviews to your blogs, or that there were 20 mentions of your brand in the press or social media last week. However, that doesn’t help you answer the awareness question in a consistent way. What we really want to know is how many unique visitors are now aware of your product or company? Measuring unique visitors makes it easy to find connections between user acquisition stages — obviously, if you know 15K unique visitors read at least one post on your blog, and 3K of them continue on to your main website and enter the exposure stage, that info is going to be much more helpful than simply knowing you got 30K unique pageviews on your blog.
They overlook overlaps
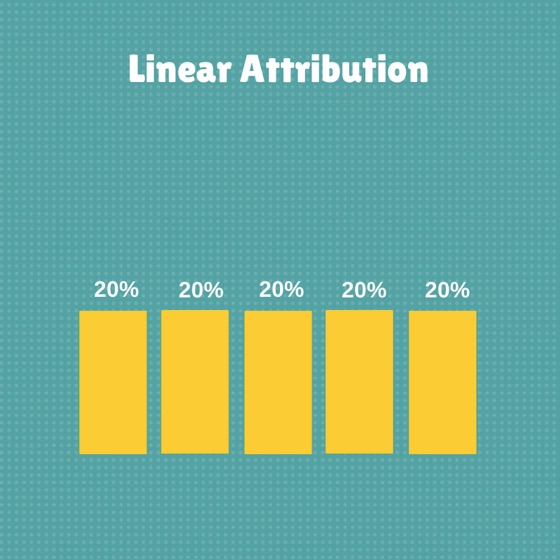
Another thing marketers often miss is that there can be overlaps between their different conversion channels. The most well-known case is with revenue attributions. You have conversions coming from advertising, organic search, email, partner sites, social media, etc. If you add up the individual revenue from all those channels, it will exceed the total revenue you actually have because of the overlaps in each channel. Make sure you choose an attribution model that reflects that. We use a linear model for its simplicity. Below is an illustration of the model where each of the 5 touch points for a conversion is given equal credits. And you can learn more about other off-the-shelf attribution models here.
Similarly at the awareness stage, if 3K visitors of your blog traffic and 1K referred traffic from partner sites came to consider your product in a month, you didn’t just acquire 4K new visitors. The actual number is going to be smaller than that depending on how much overlap there was. Being mindful of the possibility of overlap will go a long way in ensuring that the metrics you’re reporting are accurate. After all, bad decisions come from bad data as often as they come from bad judgement.
They forget to be efficient
With so many intricacies in reporting, it makes sense to focus on the most critical metrics. By critical, I mean metrics for a channel that either drives significant traffic at each acquisition stage, or consumes a lot of resources.
For example, if you know that organic social media only drives few users to your product site, and you spend no effort on it, then by all means cut it from your list of reporting metrics. But be careful and don’t start cutting right away. If you’ve just begun collecting and reporting metrics from your different channels and you don’t know which ones are working yet, you’ll need to keep tracking each one for a while. Once you gain a better understanding, though, you can begin to cut your reporting list down to narrow in on the channels that matter most. Reporting should evolve as you learn what’s working and what’s not. Remember, we report to change the way we act.
As a side note, you should always report both the cost and return side of each channel. Again, you might be getting a handful of qualified leads from one channel, but if to keep it running you have a to hire a huge team and spend a ton of ad money, the cost might be outweighing the returns, making it a bad channel.
2. Horizontal and vertical view of metrics
Now for number 2 in our three-step procedure: putting your metrics in perspective. We do that by analyzing our metrics horizontally and vertically.
To do this properly, you first need to view all your conversion channels as an unsynced funnel. Usually when we talk about funnels, we talk about the same group’s progression toward a goal. But when analyzing all of your conversion channels holistically as one funnel, you can’t do this. You have to account for the staggered timing in the flow from each channel to the next. For example, in the same month you could gain 100 new people aware of your brand and have 10 people engaged. But there’s a chance those 10 individuals trickled down from the the awareness group in the previous month, and not the new group of 100. With this in mind, we can move onto horizontal and vertical analyses.
The horizontal view looks at the volume of each acquisition stage and its conversion to the next stage. This allows us to identify the strength and weakness of each stage during the entire conversion path. For example, you might have a lot of people aware of your product, but few people visiting your site and considering your product or service. Why is that? If you are certain you’ve found product market fit, then the problem is probably that your awareness channels are not targeting high-quality leads. This comes back to the idea of consistency. Make sure you’re targeting and measuring unique visitors and not conflating them with pageviews or mentions. Your life will be much harder if you have to converge all those different measurement units when you are putting everything together for your report.
While analyzing your different building blocks from a horizontal point of view, you should also develop a sense of your company’s conversion cycle. For example, in a typical cycle, paid search is often much closer in time to payment than, say, social media mentions. This means that if you are doing monthly reporting, your metrics in each acquisition stage are synchronized in time, but desynchronized in cohort. In other words, this month’s exposure could have come from last month’s awareness, or this month’s payments could come from exposure 2 months ago. To figure out what this looks like for your own company, you should run a cohort analysis. Granted, doing cohort analyses with multiple stages in a funnel is often quite unwieldy, but it’s worth it. It will help you develop a better sense for your conversion cycle, which—again—is imperative to piecing together all your different building blocks.
Not only should you track key metrics in each acquisition stage, you should also track how much each channel and acquisition stage is growing over time.
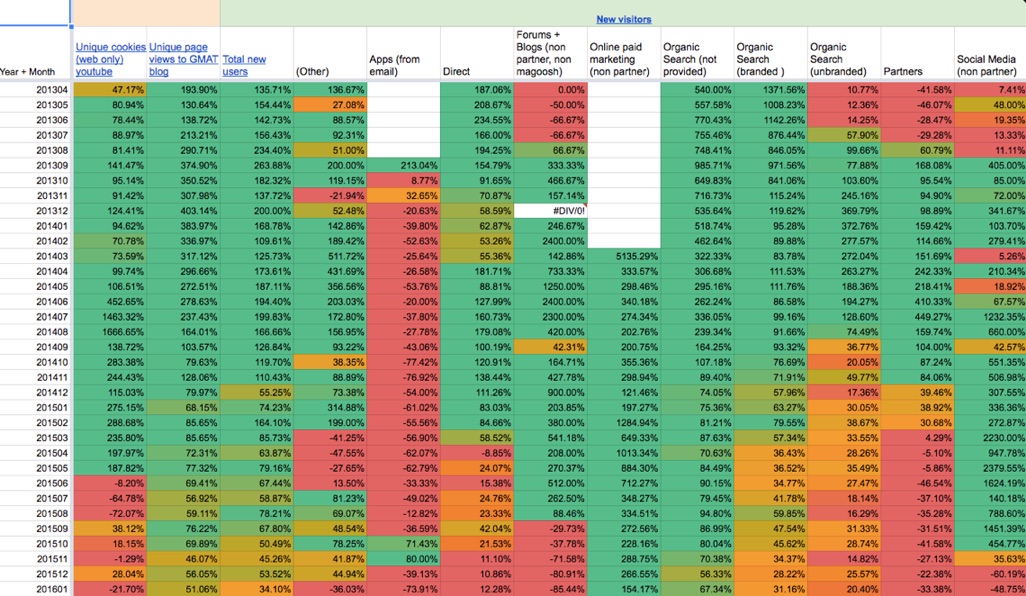
That’s where the vertical view comes in. For example, you might have a considerable number of new visitors with a high conversion rate, but you may have a dwindling number of exposures which will limit your revenue growth in the long run. Usually problems like this stem from intensified external competition or less-favorable internal resource allocation toward new-user acquisition. Analyzing your metrics with a vertical point of view alerts you to such problems that you otherwise wouldn’t find. When I worked on our marketing metrics, we decided to color code the metrics based on historical data to highlight potential risks. It then became quite obvious to us what was lagging in our overall marketing efforts. Below is an example of a part of a color-coded report.
3. Determining causality
I tend to be quite skeptical about causal relationships between different variables, and so should you. Obviously, when you invest in a channel, it will appear that it’s helping you drive payments (unless of course the channel is terrible at targeting payers). However, it’s often quite unclear whether a channel is actually good at converting people who wouldn’t otherwise, or simply good at finding people who would pay regardless.
If you read articles about marketing pro-tips and technical advancement, you’ve probably noticed they’re often filled with unverified claims like “seamless integration of mobile and desktop advertising improves your ROI by x%,” or “a patented prospecting algorithm expands your new visitor base and increases your profitability,” etc. Rather than buying all of this, you should find out what is true of your own business.
For example, if you have a pretty good base of SEM and SEO, and you’d like to expand expenditure on prospecting campaigns, then you should test the effectiveness of these new campaigns by running an A/B test. One experiment you could try is separating out a random 50% chunk of ad space in one of your prospecting campaigns and replace your ad with a public service announcement that has nothing to do with your product. Leave the other 50% for your regular campaign ads. If you compared the performance between the two groups, you’d get an idea of how much incremental value prospecting brings on top of your current advertising mix. The result may very well surprise you, and it is almost guaranteed to be much smaller than the amount of revenue that your vendor claims to contribute.
I often have to determine causality (or lack of it) in my own work. When it comes to marketing attribution, there are three tiers of analytical methods you can use to understand multiple channels and how each one in silo contributes to an end goal. Those are:
- Arbitrary weighting. Those are the off-the-shelf solutions I mentioned earlier, where you make assumptions about how much credit to give to each channel based on its position. Even the seemingly “fancy” attributions like position-based model, or time-decay model, etc. are still very much just arbitrary weightings of each channel. This is the most basic, and least accurate way to understand marketing effectiveness—although at least it takes care of the overlap problem in channels.
- Regressions. If you observe each touch point in each acquisition stage for all your audiences, then you can run some sort of regression to attach a value to each of your channels. That value represents the average contribution of that specific channel among all the other channels. This is a lot less arbitrary, and has some statistic rational behind it. There are companies like Convertro that specialize in doing this type of analysis.
- Experimentation. Experimenting is almost the only hope for determining true causality. Its shortcoming is that it’s very expensive. In today’s world, the marketing landscape is so multi-faceted that it’s impossible to test everything. That said, it’s still important to segment out those one or two high-cost channels and try to understand their incremental value through experimentation.
I certainly don’t like arbitrary weighting, but I sometimes have to use it, especially when I’m trying to set the baseline of different channels. Regressions and experimentations are better suited for fine-tuning a specific channel. At this point, if you had followed the previous steps I outlined, you would have already set up a base of main metrics, teased out clear deadweight, and allocated more resources to the underfunded areas with good potential. The natural next step would be to question causality among your channels and collect some evidence to validate your hypothesis.
Overall, I think the industry standard of marketing metrics could be a lot higher if we ask more critical questions. As a quick recap, we should ask the following three:
- Are our measurements consistent, accurate, and efficient?
- Do we know how each metric fits between all metrics over time?
- Is that one channel that seems to drive so much revenue really a causal factor?
If you start to ask these questions when you are doing marketing reporting, you will eventually grasp the pulse of your marketing efforts. Good luck!
About the Author: Sam Ju is trained as an economist and works as the data scientist at Magoosh. He works across product and marketing teams to roll out the most helpful features and optimize marketing efforts. He has an MS in Development Practice from UC Berkeley, and a BA in Management from Renmin University of China.
No comments:
Post a Comment